Rim Country Short Term Rentals

What AirDNA’s broad Payson market data tells REALTORS® and brokers
THE TAKEAWAY Rim Country’s short-term-rental market remains active and commands stable nightly rates, but owners are competing for slightly fewer booked nights. Supply increased, occupancy and average revenue declined, and property-specific performance varies widely.
AirDNA data through June 2026 describes a mature regional short-term-rental market with 636 active listings. Average annual gross revenue was $35,730, down 3.9% from the prior year. Occupancy was 47%, down 4.1%, while the average daily rate held nearly flat at $226.08, up 0.3%. RevPAR – revenue per available rental night – declined 1.0%.
The combination matters more than any single number: supply rose 2.8%, yet booked-night demand softened and the typical stay shortened. The result was somewhat more competition without a broad collapse in nightly pricing.
AirDNA’s Payson market is not limited to the incorporated Town of Payson. The supplied boundary extends across a broad portion of Rim Country and includes communities and rural areas around Pine and Strawberry, Christopher Creek, Forest Lakes, Young and Roosevelt.
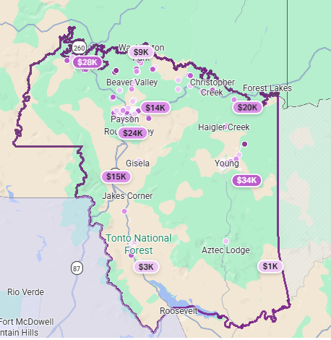
Figure 1. AirDNA’s Payson market boundary
Source: AirDNA Market Explorer screenshot supplied to CAAR, July 2026.
REPORTING NOTE Market-wide results should not be presented as results for Payson town limits, any individual community, or any particular property.
Market measure | Current | Past year |
Annual gross revenue | $35,730 | -3.9% |
Active listings | 636 | +2.8% |
Average daily rate | $226.08 | +0.3% |
Occupancy rate | 47% | -4.1% |
Source: AirDNA Market Explorer. Revenue is gross market revenue, not owner profit.
The clearest market signal is the divergence between supply and utilization. Active listings increased 2.8%, while occupancy and annual revenue declined. Because ADR remained essentially unchanged, the revenue decline appears to be driven primarily by booking volume, availability and listing mix rather than widespread price cutting.
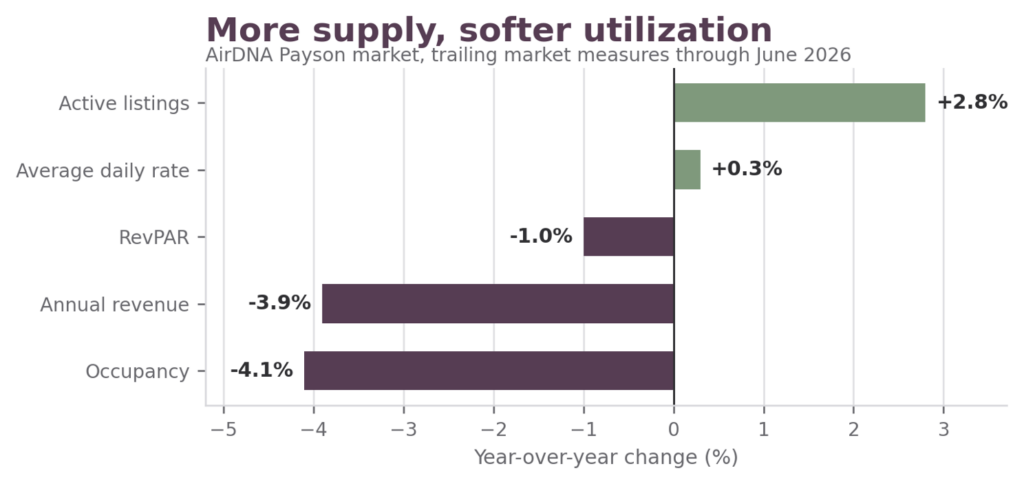
Figure 2. Year-over-year change in headline market measures
Source: AirDNA Market Explorer, data through June 2026.
Active supply also remains seasonal. Listings climbed to 655 in August 2025, dropped to 563 in February 2026, and recovered to 636 by June. That pattern cautions against treating every deactivation as a permanent market exit; some owners appear to pause or limit availability during weaker periods.
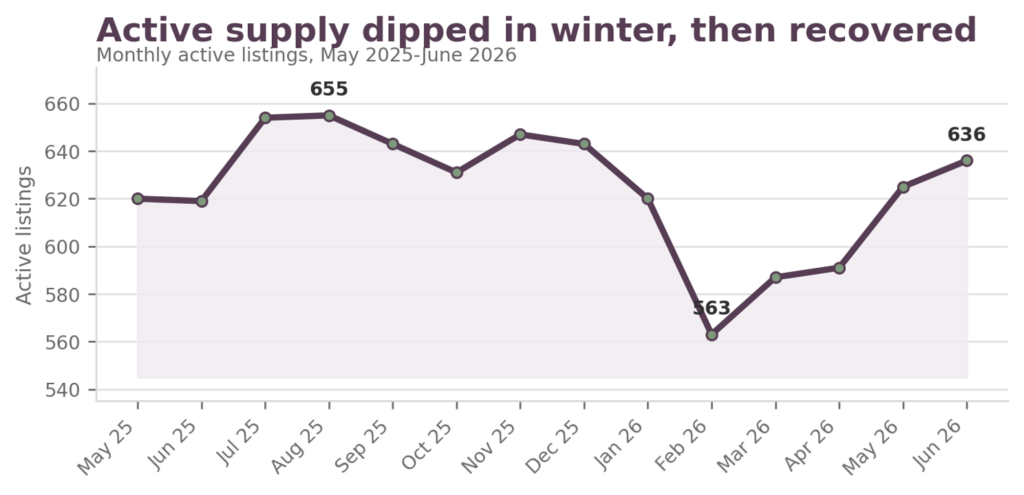
Figure 3. Monthly active listings
Source: AirDNA Market Explorer screenshots supplied to CAAR. July 2025 figure added from the final screenshot.
The annual occupancy figure of 47% does not mean demand is evenly distributed throughout the year. Monthly occupancy has generally been strongest in June and July and weakest in January and February. March also produces a recurring shoulder-season lift.
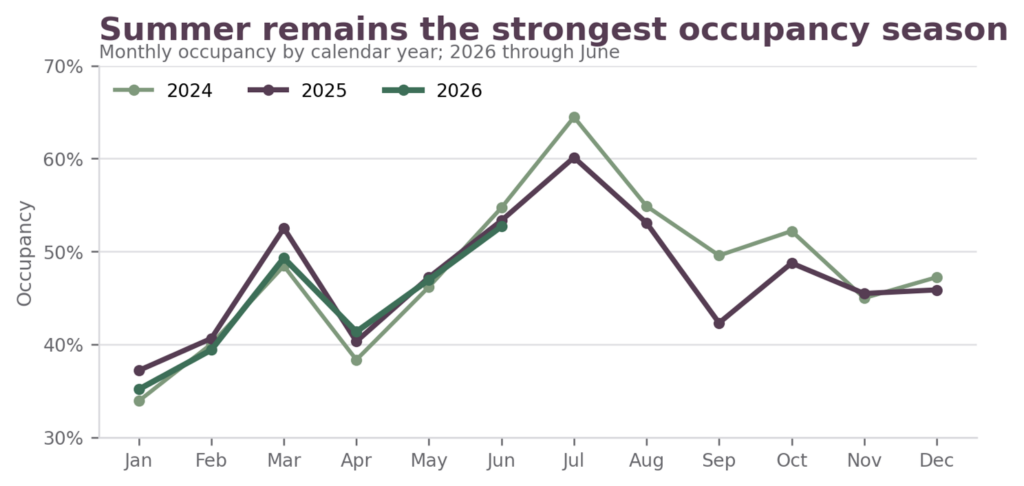
Figure 4. Monthly occupancy by year
Source: AirDNA Market Explorer export. Occupancy is booked nights divided by nights available to be booked.
AirDNA reports a 40-day average booking lead time and an average stay of about three days. Length of stay declined modestly during the past year. Forward reservation activity also shows the familiar weekend pattern, with booked-listing counts rising most sharply around Fridays and Saturdays.
Three-bedroom rentals are the largest segment at approximately 33% of the market, followed by two-bedroom rentals at 29% and one-bedroom rentals at 20%. Together, two- and three-bedroom properties account for about 62% of the market.
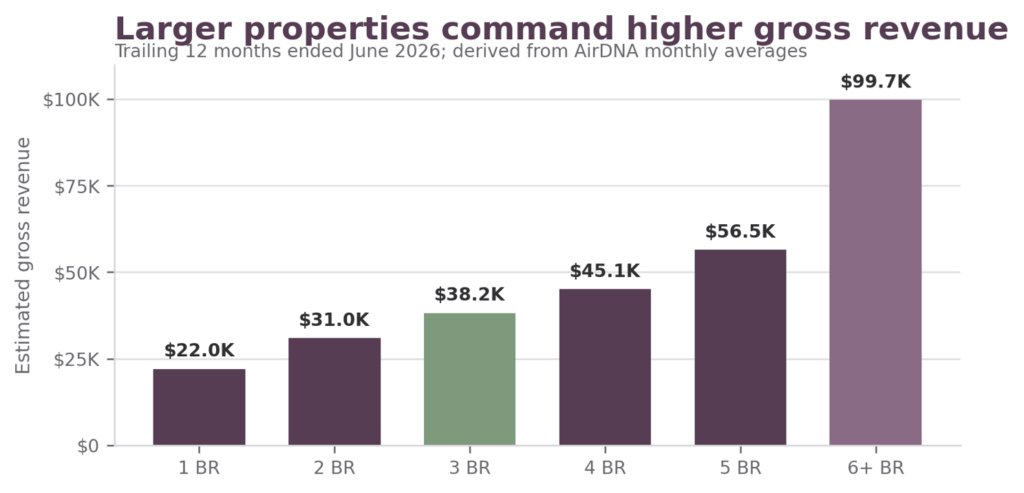
Figure 5. Estimated trailing-12-month gross revenue by bedroom count
Source: CAAR calculation from AirDNA monthly average listing revenue, July 2025-June 2026. Six-plus-bedroom results are based on a small, volatile segment.
The bedroom comparison is useful for market orientation, but it should not be treated as a valuation formula. Larger homes can accommodate groups and command higher rates, but they may also require greater capital investment, furnishing, utilities, cleaning, maintenance and management.
For June 2026, AirDNA reported monthly listing revenue of approximately $1,970 at the 25th percentile, $3,121 at the median, $4,621 at the 75th percentile and $6,499 at the 90th percentile. The spread is a reminder that the $35,730 annual market average is not a reliable projection for every home.
IMPORTANT AirDNA revenue is gross revenue. It includes nightly rates and cleaning fees, less specified discounts and platform service fees; it does not represent net operating income or owner profit.
AirDNA’s review-based guest insights highlight large decks or patios, fenced areas for pets, fire pits, stocked kitchens and comfortable furnishings. Common complaints include noise, cleanliness, unreliable Wi-Fi, missing supplies and confusion about property features. These themes are qualitative, but they reinforce the importance of accurate listing descriptions and consistent property operations.
Rim Country remains an established short-term-rental destination with stable nightly pricing and pronounced summer demand. The market is not collapsing, but it has become somewhat more competitive: supply is up, occupancy and average annual revenue are down, and guests are taking slightly shorter trips.
For CAAR members, the practical lesson is straightforward. Regional averages are useful for understanding direction, but responsible advice requires a property-specific analysis and a clear explanation of risk, expenses and restrictions.
Market data: AirDNA Market Explorer, AirDNA-defined Payson market, accessed July 27, 2026. Historical exports cover periods through June 2026. Figures labeled “past year” are AirDNA’s reported year-over-year changes. Figures may not sum because of rounding, platform matching, availability rules and differing denominators.
AirDNA occupancy methodology: How AirDNA calculates occupancy rate
AirDNA revenue methodology: How AirDNA calculates revenue
Prepared for informational and educational use by CAAR members. This report is not a property appraisal, income guarantee, legal opinion, tax advice or investment recommendation.
Interested in what CAAR does and how you can get involved? Contact us below to talk to our team.