The New Rim Country Listing Playbook

How agents and brokers can recalibrate pricing, preparation, negotiation, and client expectations in a more buyer-friendly market
By Dennis R. Riccio, President of the Central Arizona Association of Realtors | August 2026
Rim Country real estate did not stop moving in July. It changed its negotiating posture. Buyers now have more homes to compare, sellers face more visible competition, and the first few weeks of a listing matter more than they did during the peak seller-market years. For agents and brokers, this is a market that rewards disciplined pricing, early problem-solving, and careful communication.
535 | 7.4 | 859 | 96.2% |
Active listings in July | Months of inventory | Sales in prior 12 months | Sale-to-final-list ratio |
Source: Central Arizona MLS / Flexmls data compiled for the August 2026 Rim Country Real Estate Market Report. Inventory figures cover selected Rim Country areas.
Active residential inventory across the selected Rim Country areas increased from 314 homes in January to 535 in July, an increase of approximately 70%. Over the same period, estimated months of inventory rose from about 4.6 to 7.4 months. That is the clearest signal that the negotiating environment has changed.
The shift does not mean that buyers disappeared. During the 12 months ending July 31, 2026, 859 residential properties closed for a combined $447.1 million. July alone produced 70 closings in the selected areas. Serious buyers remain in the market, but many feel less pressure to overlook condition problems, accept aggressive pricing, or waive protections simply to secure a property.
LOCAL MARKET OBSERVATION |
The average residential property sold approximately $20,676 below its final list price. In aggregate, closed properties sold for about 96.2% of final list price and 92.5% of original list price. The difference between those two ratios matters. It suggests that a portion of the market required one or more price adjustments before buyers viewed the property as competitive.
This does not mean every seller should expect a large discount. A well-positioned home can still sell close to asking, particularly if it is move-in ready, appropriately priced, or difficult to replace. The practical lesson is that “room to negotiate” is not a pricing strategy. Starting too high can cost the listing its strongest launch window and force the seller to chase a changing market.
Closed comparable sales remain essential, but they are only part of the conversation. Buyers make decisions against active alternatives. A seller may have a strong comparable from several months ago, yet lose attention if a current competing home offers better condition, better photography, a more attractive total monthly cost, or a price that is easier to understand.
A useful listing presentation should therefore distinguish among closed evidence, pending indicators, active competition, and expired or withdrawn listings. Each category answers a different question. Closed sales help establish value. Pending listings show where buyers recently acted. Active listings reveal the seller’s immediate competition. Expired and withdrawn listings help explain what the market rejected.
The seller-side playbook
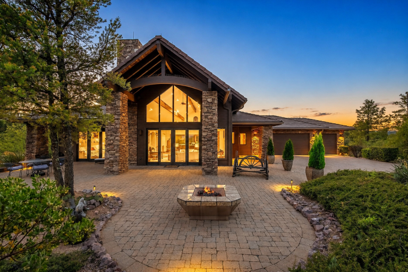
Presentation must earn attention before a buyer schedules a showing.
Begin with the property’s likely buyer pool and realistic competitive set. A site-built home should not be blended casually with manufactured housing, and a golf-community residence is not interchangeable with an in-town home merely because the prices overlap. In Rim Country, views, access, lot characteristics, utilities, roads, amenities, and wildfire exposure can materially change marketability and value.
When buyers have more options, deferred maintenance becomes a comparison point. Before photography, walk the property with the eyes of a skeptical buyer. Address simple repairs, cleanup, lighting, odors, clutter, landscaping, and obvious safety concerns when practical. For larger issues, decide whether the seller will repair, price accordingly, or disclose and document the condition.
The early response is valuable evidence. Few showings may indicate a price, presentation, access, or marketing problem. Showings without offers may point to condition, insurance cost, layout, or a mismatch with the competing set. Summarize consistent objections for the seller before the listing loses momentum.
A price reduction is not the only tool. Depending on the property, financing, and seller’s net, consider closing-cost assistance, an interest-rate buydown, selected repairs, septic or well documentation, furnishings, or flexible timing. A concession should solve an identified buyer concern, not decorate an overpriced listing.
Professional photography, accurate descriptions, floor plans when available, video, and appropriate drone imagery help buyers understand the property before they visit. In a mountain market, also clarify access, parking, outdoor living, views, vegetation, storage, and features affecting full-time or seasonal use.
The buyer-side playbook

A stronger buyer consultation connects market leverage with property-specific risk.
Greater inventory gives buyers leverage, but not a reason to become careless. The best representation combines patience with property-specific diligence. A unique cabin or well-priced, move-in-ready home may still attract decisive interest.
Regional averages provide context, but do not dictate the correct offer. A long-marketed home with unresolved condition concerns may justify a different strategy from a new, well-prepared listing in a scarce segment. Connect each requested term to evidence: condition, market time, competition, financing needs, and the seller’s apparent priorities.
A USEFUL BUYER QUESTION |
More negotiating leverage at the offer stage does not eliminate execution risk. Inspection response deadlines, insurance underwriting, appraisal support, lender documentation, septic or well evaluations, title matters, and repair verification still require active management. Brokers can help by standardizing checklists and escalation points for transactions involving rural systems or wildfire-related underwriting concerns.
Rim Country is not one market
Regional statistics are useful for direction, but the differences among local areas are substantial. During the 12 months ending July 31, median prices ranged from $292,500 in Star Valley to $559,000 in Happy Jack among the ten higher-volume areas shown below. Average marketing times ranged from 105 days in Christopher Creek to 160 days in Happy Jack.
Area | Sales | Median price | Avg. DOM |
Payson Northeast | 152 | $461,200 | 129 |
Payson Northwest | 132 | $422,500 | 111 |
Pine | 117 | $475,000 | 117 |
Payson Southeast | 97 | $499,000 | 108 |
Happy Jack | 57 | $559,000 | 160 |
Star Valley | 50 | $292,500 | 110 |
Strawberry | 46 | $408,500 | 124 |
Tonto Basin | 44 | $312,000 | 156 |
Payson Southwest | 38 | $416,250 | 112 |
Christopher Creek | 35 | $455,000 | 105 |
Closed residential sales from August 1, 2025 through July 31, 2026. Smaller communities can experience large statistical swings when only a few properties close. Source: Central Arizona MLS / Flexmls.
These figures should not be used as automatic adjustments in a comparative market analysis. They demonstrate why one broad Rim Country number cannot substitute for neighborhood, property-type, and price-segment analysis. Payson Northeast led the listed areas with 152 sales, while Pine recorded 117 sales and a $475,000 median. Happy Jack’s $559,000 median was paired with a 160-day average marketing time, reflecting a different product and buyer pool. Star Valley’s $292,500 median reflects another mix of property types and price points.
The regional average residential sale price was $520,520, compared with a median of $437,000. A limited number of high-priced transactions can lift the average substantially. The median, which marks the midpoint of all sales, is often a better starting point for describing a typical transaction. Neither number establishes the value of a particular home.
Site-built homes represented 661 of the 859 sales, or 76.9%, with a $499,000 median. Post-1976 manufactured homes accounted for 150 sales, or 17.5%, with a $292,000 median. Condominiums, mobile homes, park models, and modular homes supplied additional ownership options. Agents should segment the data before discussing value, financing, or marketing time with clients.
Five conversations before taking the listing
A more buyer-friendly market is not a weak market. It is a market in which professional representation becomes easier to see. Sellers need candid advice about competition, preparation, and timing. Buyers need help converting broader leverage into a property-specific strategy without missing a genuinely good opportunity. Brokers need systems that support both conversations consistently.
The agents who thrive in this environment will not be the ones who simply repeat that inventory is up. They will explain what the additional inventory changes, what it does not change, and how the client should respond. In Rim Country, that means pairing market statistics with local knowledge about property types, utilities, access, insurance, wildfire considerations, seasonality, and the lifestyle each community offers.
BOTTOM LINE |
PUBLICATION NOTES
Closed-sale figures cover August 1, 2025 through July 31, 2026 and include all MLS residential subtypes within the geographic scope of the supplied August 2026 Rim Country report. Selected inventory totals exclude Heber/Overgaard and obsolete directional areas. MLS information is deemed reliable but is not guaranteed. Broad statistics should not substitute for a property-specific comparative market analysis.
Interested in what CAAR does and how you can get involved? Contact us below to talk to our team.