Rim Country Market Update

CAAR Member Briefing for REALTORS® and Brokers
June 2026 data, presented by Dennis Riccio, 2026 CAAR President
Buyers have not disappeared. During the reporting period, 1,003 residential properties sold for a combined volume of approximately $519.4 million. The median residential sale price was $429,000, and the average sale price was approximately $517,870.
The more important change is what has happened with supply. Broad residential inventory declined through the winter and then rose sharply during spring and early summer. Active listings increased from roughly 340 in January to about 560 in June. During the same period, estimated months of inventory rose from approximately 4.7 months to 7.4 months.
That does not mean every neighborhood or price range has become a buyer’s market. It means buyers generally have more alternatives, sellers face more competition, and pricing, condition, presentation, and negotiation strategy matter more than they did during the peak seller’s market.
Reporting period: June 1, 2025 through June 30, 2026. Residential statistics only.
Residential sales | 1,003 | Sales volume | $519.4 million |
Median sale price | $429,000 | Average sale price | $517,870 |
Avg. days on market | 120 | Avg. sale-to-original-list-price ratio | 94.3% |
Estimated months of inventory, June | 7.4 months | Active listings, June | 560 |
Member framing: Inventory and marketing-time trends are now more important in listing strategy conversations than they were in the peak seller’s market. These charts are intended to support agent coaching, office discussion, CMA framing, and client education. |
The following charts have been reworked for a REALTOR® and broker audience. Each one is designed to support conversations about pricing discipline, seller preparation, buyer leverage, negotiation expectations, and office-level market interpretation.
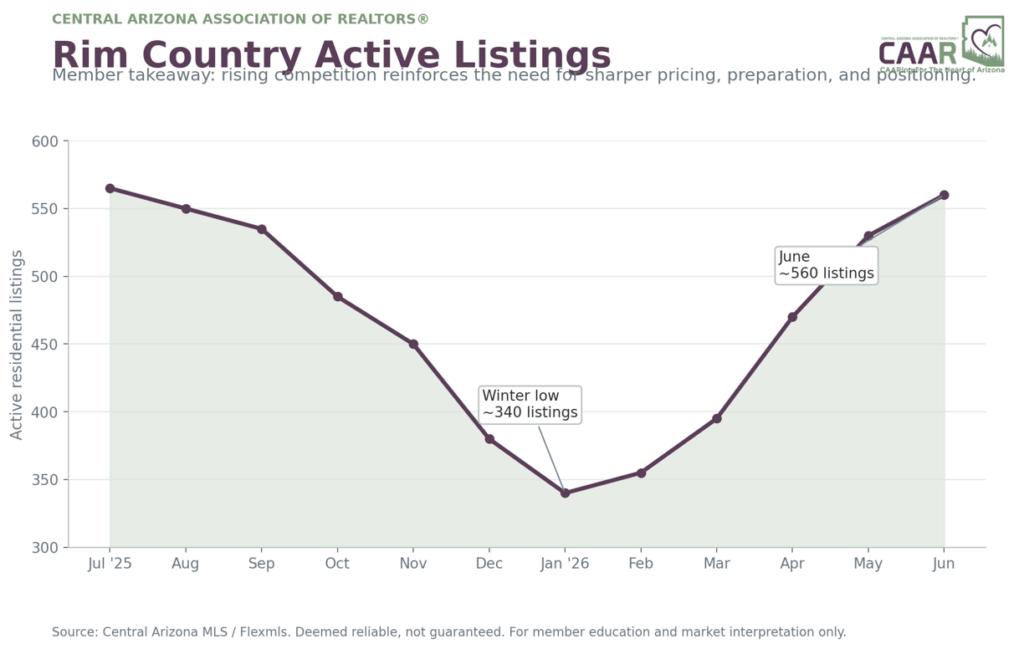
Member use: active inventory helps explain why proper preparation, presentation, and timely price adjustments matter more when buyers have more options.
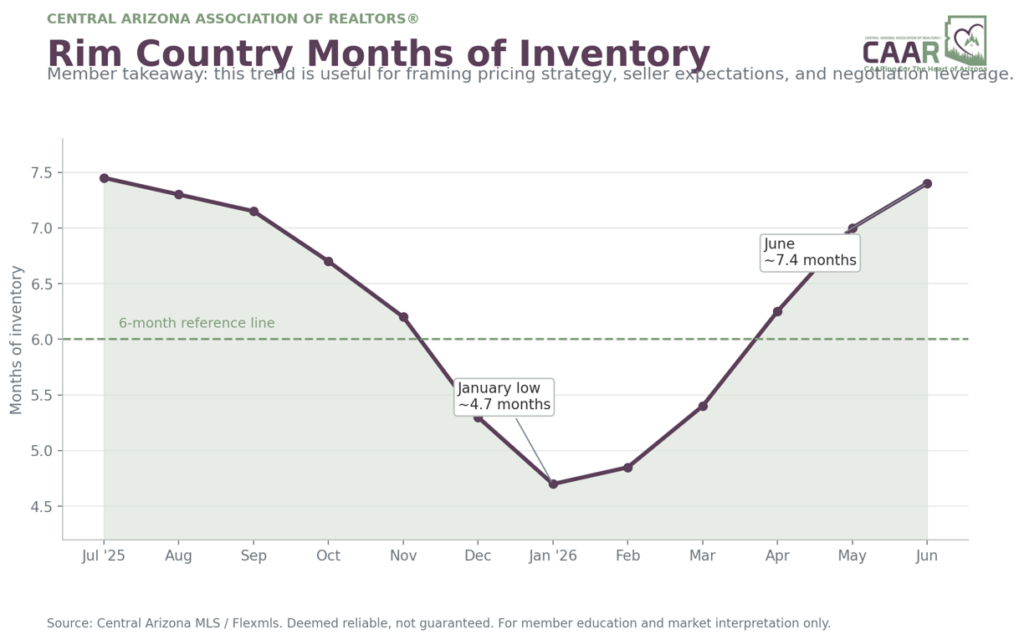
Member use: months of inventory is a practical way to frame the overall balance of the market without oversimplifying any individual neighborhood or property.
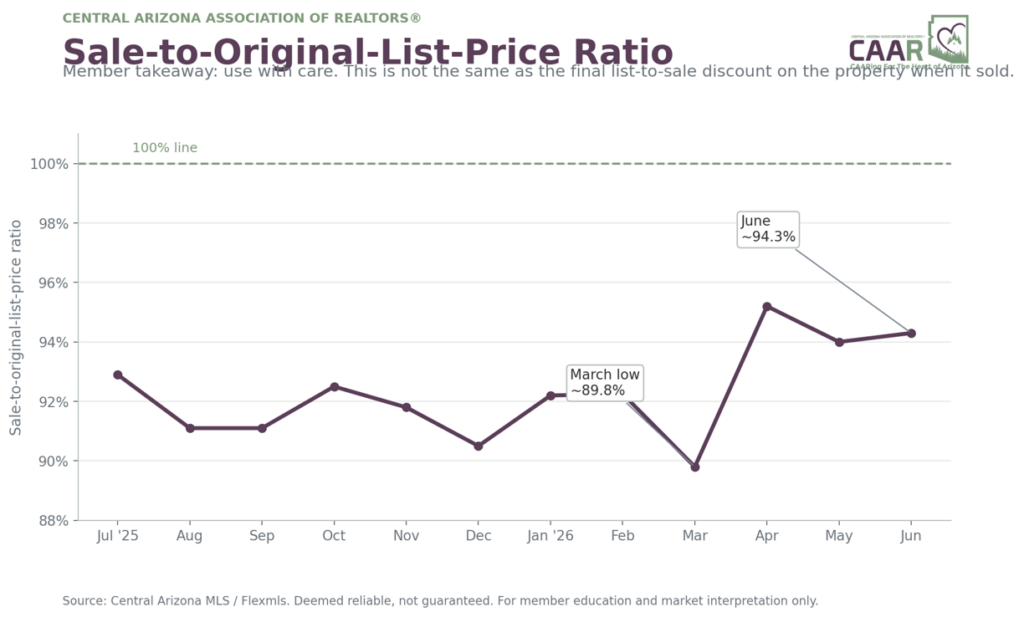
Member use: this ratio should be explained carefully. It compares the sale price to the original asking price, not necessarily to the final list price in effect when the property went under contract.
Members should be careful when describing the approximately 94% sale-to-original-list-price ratio. It is not necessarily the average discount a buyer received from the price in effect when the offer was written. A property may have undergone one or more price reductions before it sold. The average difference of approximately $21,191 between final list price and sale price is a separate statistic. Both figures are useful, but they answer different questions and should not be presented as interchangeable.
Regional statistics identify direction, but they should not replace neighborhood-, property-type-, and price-range-specific analysis. The area comparisons below illustrate why broad averages must be used carefully.
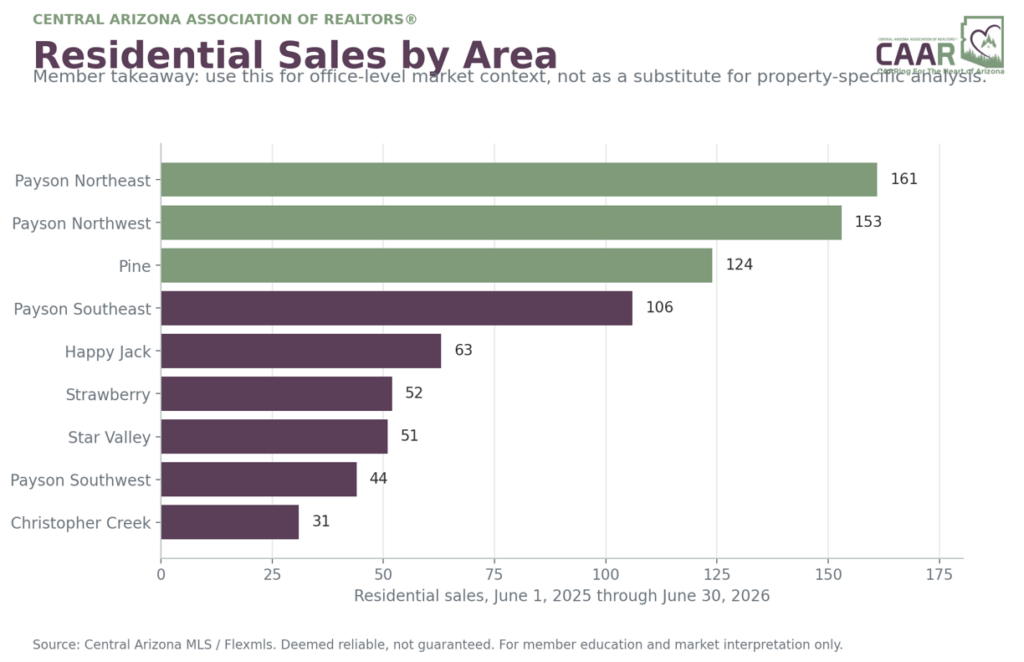
Member use: transaction count helps place local activity in context for office planning, prospect conversations, and submarket awareness.
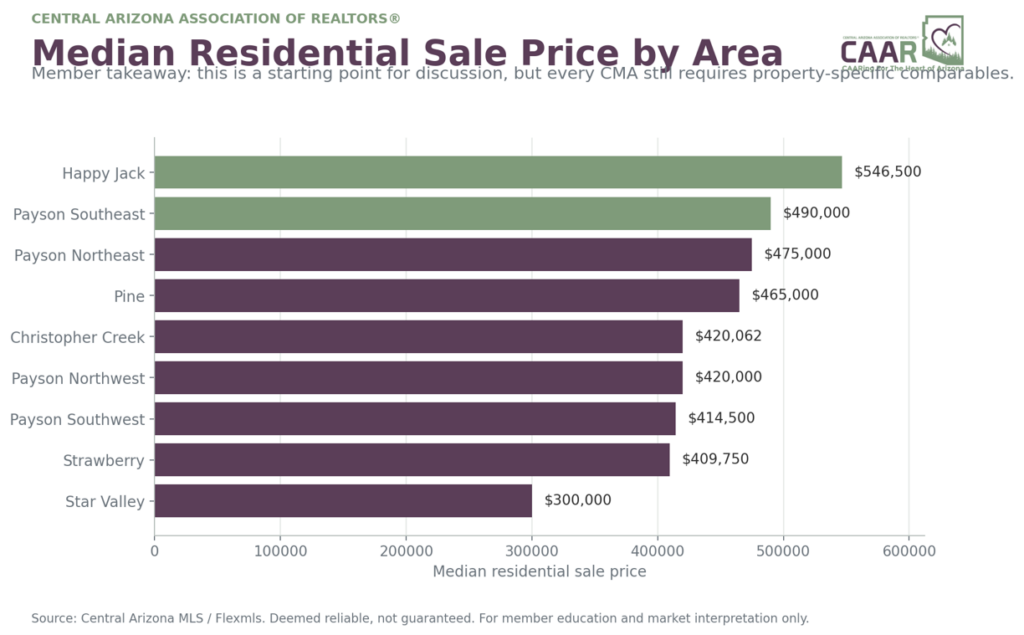
Member use: median price can frame broad market positioning, but it should never be treated as a stand-alone valuation tool for a specific property.
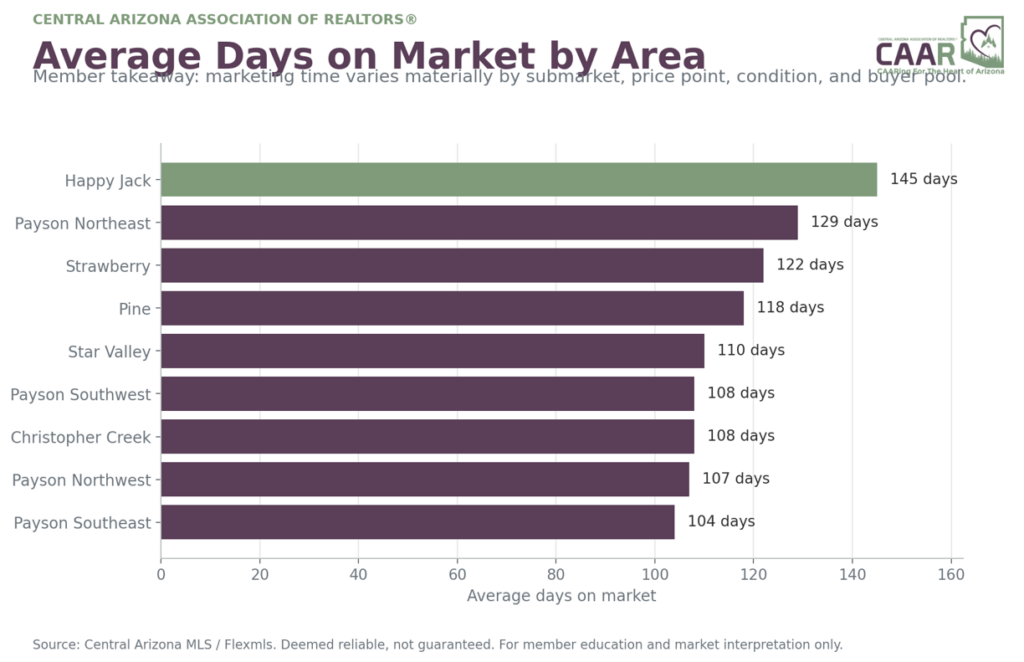
Member use: average days on market can help set expectations, especially when comparing different buyer pools such as Payson, Pine, Strawberry, and Happy Jack.
Among the four Payson quadrants, Payson Southeast recorded the highest median sale price and the shortest average marketing time, while Payson Northeast had the most transactions and the highest average sale price. Pine remained a significant secondary market with 124 residential sales. Happy Jack posted a higher median price but a longer average marketing period, reflecting a different buyer pool and property mix.
Use with caution: Small-area statistics can move sharply with a limited number of sales. In communities such as Christopher Creek, Strawberry, or Happy Jack, a handful of transactions can materially influence the median, average, and days-on-market figures. |
The Rim Golf Club and Chaparral Pines should not be interpreted through the same lens as the broader residential market. In June, The Rim showed approximately 16 active listings and an estimated absorption rate above 20 months. Chaparral Pines showed approximately 39 active listings and an estimated absorption rate near eight months. With higher price points and fewer monthly sales, one or two transactions can materially change averages, sold-to-list ratios, and absorption estimates.
The appropriate conclusion is not simply that one community is “strong” or “weak.” Luxury analysis should consider the individual home, lot, view, construction quality, furnishings, club membership considerations, competitive inventory, and the depth of the qualified buyer pool.
The present market reinforces the value of skilled representation. When inventory rises and conditions vary significantly by neighborhood, property type, and price range, consumers need more than a regional average or an automated valuation.
They need REALTORS® who can interpret the data, explain competing inventory, evaluate condition and marketability, prepare clients for negotiation, and adjust strategy as the market responds. That is where CAAR members provide their greatest value.
Dennis Riccio
2026 President
Central Arizona Association of REALTORS®
Statistics were compiled from Central Arizona MLS / Flexmls reports. The principal residential sales figures cover June 1, 2025 through June 30, 2026; monthly inventory and absorption figures reflect June 2026 market summaries and preceding monthly trends. Figures are historical, may change as listings are updated, and are deemed reliable but not guaranteed. Market-wide statistics are not a substitute for a property-specific comparative market analysis.
Interested in what CAAR does and how you can get involved? Contact us below to talk to our team.