Rim Country Short Term Rentals

End of Summer Market Update
By Dennis Riccio
President, Central Arizona Association of REALTORS®
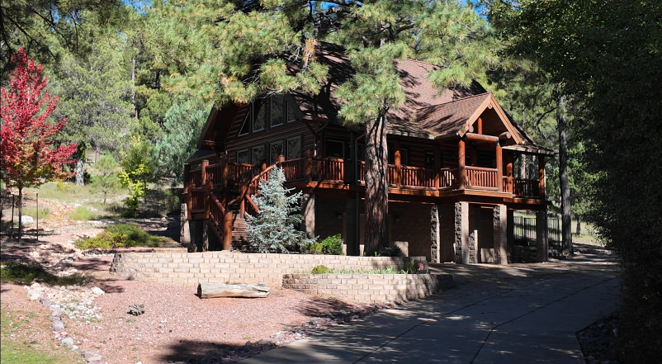
A cabin setting reflects the forest retreat experience highlighted in AirDNA’s guest-review summary. Photo provided by Dennis Riccio.
For clients considering a second home, short-term rental income can be an important part of the buying decision. AirDNA’s latest Payson-area data gives us a useful starting point: overall performance has softened, but summer remains an important revenue season. The numbers also remind us to evaluate each property individually rather than treat a market average as an income promise.
This update examines monthly results through August 2026. AirDNA’s “Payson” submarket covers a broad surrounding area beyond the town limits, as shown on its boundary map. These figures should therefore be read as a regional rental benchmark, rather than a town-only report.
Metric | Latest overview | Past year change |
Active listings | 628 | −4.1% |
Average annual revenue | $35,927 | −2.0% |
Average daily rate | $227.62 | +1.0% |
Occupancy | 47% | −3.7% |
Source: AirDNA overview supplied October 3, 2026. Annual measures are shown separately from the January–August monthly comparisons. Changes are reproduced as displayed by AirDNA; the occupancy change is not labeled here as a percentage-point change.
Fewer active listings, lower occupancy and slightly lower annual revenue suggest a softer overall market. A modest increase in the average nightly rate has not translated into stronger annual revenue. The listing decline alone does not establish whether owners sold, stopped renting or temporarily removed availability.
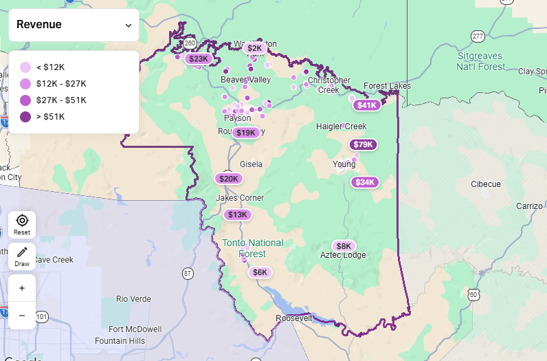
AirDNA’s Payson submarket boundary is shown in purple. The reporting area extends well beyond Payson’s town limits. Source: AirDNA map supplied October 3, 2026.
July was the strongest month for occupancy and average monthly revenue in the January–August 2026 data. Occupancy reached 60.65%, compared with 60.25% in July 2025. Average revenue per booked listing rose to approximately $4,351 from $3,974, an increase of about 9.5%. August then eased: occupancy was 49.59%, versus 53.12% a year earlier, and average revenue declined about 5.0% to $3,281.
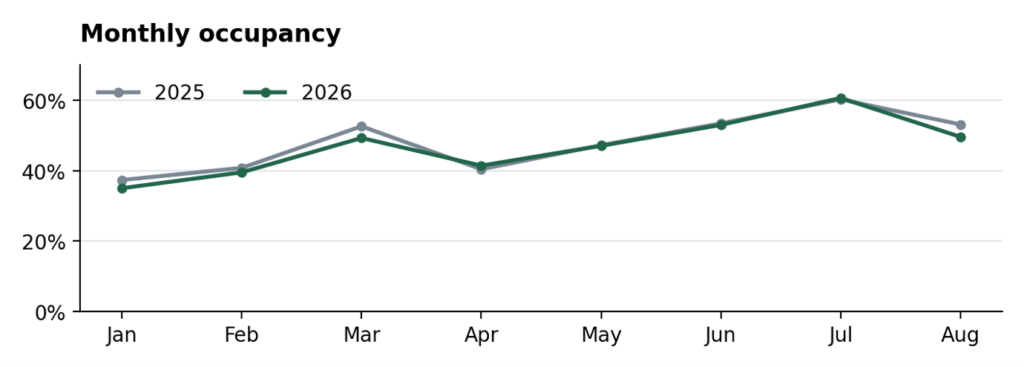
Figure 1 Occupancy measures booked nights relative to nights available for booking, rather than all calendar nights. Source: AirDNA monthly occupancy export.
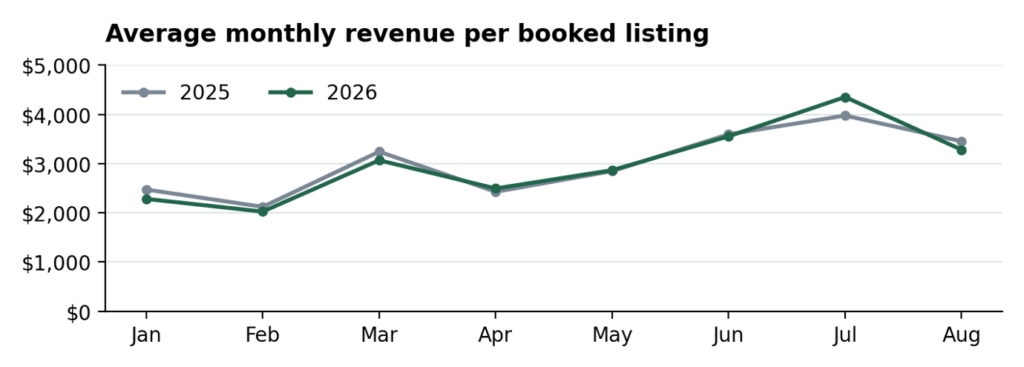
Figure 2 Monthly revenue is averaged across listings receiving at least one booking that month. Source: AirDNA monthly revenue export.
The broader demand picture was relatively steady: booked listing nights totaled 62,609 from January through August 2026, down approximately 1.7% from 63,699 in the same period of 2025. These are rental nights, not a count of guests. A strong July should not obscure quieter months or become the basis for a year-round income projection.
For buyers, the first step is to compare a proposed rental with similar properties in its immediate area, including bedroom count, condition, amenities and intended availability. AirDNA’s overview shows that 97% of listings are entire homes and that three-bedroom properties make up the largest share, at 33%. Those figures describe the existing supply; they do not prove that three bedrooms will deliver the best return.
Owner use also matters. The overview shows that 56% of listings are available for 271–365 nights annually, while 32% are available for 180 nights or fewer. A buyer who reserves popular summer weekends for personal use will have a different earning opportunity from an owner who makes those dates available to guests. The reported 47% occupancy should not be multiplied by 365 without considering that availability.
Revenue is only one part of the ownership calculation. Buyers should build a property-specific budget for financing, insurance, utilities, management, cleaning, maintenance and replacement reserves. AirDNA’s revenue estimates are not owner profit, and actual operating history is particularly valuable when evaluating an established rental.
AirDNA’s guest-review summary emphasizes peaceful surroundings, wildlife sightings, mountain and forest views, and access to trails and lakes. It also highlights local shops and eateries. These themes suggest that the experience a property offers deserves attention alongside its bedroom count and nightly rate. They are qualitative observations from AirDNA’s summary, rather than a separate guest survey.
As CAAR members, we can help clients move from a broad regional statistic to a realistic assessment of a specific home. My takeaway is that short-term rental potential deserves careful analysis across the full year, with property-level comparisons and expenses considered before a buyer relies on rental income.
Data notes: AirDNA screenshots and CSV exports supplied October 3, 2026; monthly performance through August 2026. Figures are estimates and market averages, not guaranteed property results. Monthly revenue averages exclude listings without a booking that month, and the properties contributing to an average can change. Revenue includes cleaning fees and reflects AirDNA’s fee and discount adjustments. Definitions: AirDNA Help Center, “How does AirDNA calculate revenue?” and “How does AirDNA calculate occupancy rate?”
https://help.airdna.co/en/articles/8374548-how-does-airdna-calculate-revenue
https://help.airdna.co/en/articles/8062178-how-does-airdna-calculate-occupancy-rate
Interested in what CAAR does and how you can get involved? Contact us below to talk to our team.